The Power BI logo shows how the business of the company’s clients grows and strengthens, and the software allows you to observe and record this process. No fluctuations will go unnoticed. The emblem hints that analytics and prosperity are inseparable.
Power BI: Brand overview
| Founded: | 11 July 2011 |
| Founder: | Microsoft |
| Headquarters: | United States |
| Website: | powerbi.microsoft.com |
Meaning and History
The basis for the analytical software was the development of two employees from the SQL Server Reporting Services Team – Amir Netz and Thierry D’Hers. It was then taken over by Ron George, who brought to market a digital product called Project Crescent. It was first released to the public in the summer of 2011 in addition to SQL Server Codename Denali. Later, Microsoft renamed the program to Power BI and introduced it as one of the functional tools for Office 365. This happened in 2013.
Initially, the utility was based on Microsoft Excel add-ins, but then the developer company expanded its capabilities by introducing several additional options. The circle of potential users has also increased since previously, it was designed for individual analysts and small enterprises that do not have their own developed IT infrastructure. In this version, the product was offered to the public in 2015.
In 2017, within Power BI, a separate edition of Report Server and a specialized version of Desktop RS appeared. These are cloud-based business intelligence (BI) services and a desktop interface. They are complemented by interactive information panels, search, discovery, preparation, and information storage. The key difference between the service and analogs is loading custom visual data. The whole essence of digital technologies is reflected in a simple logo that has gone through two modifications.
2013 – 2016
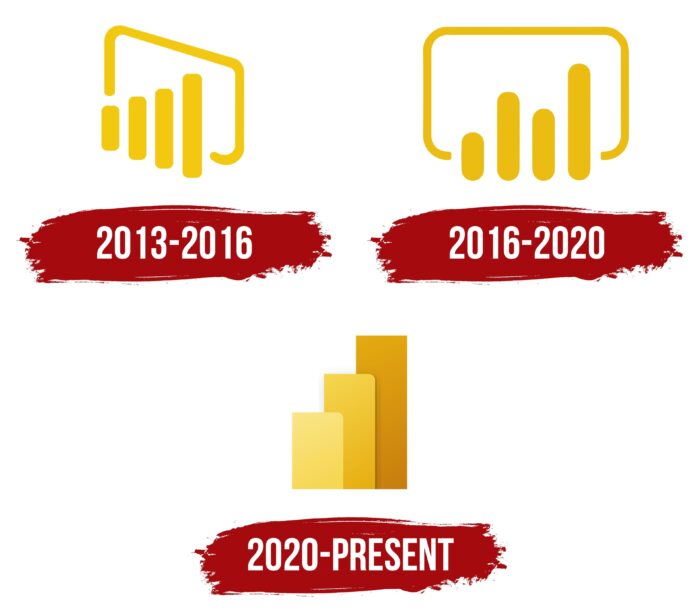
The corporate logo never contained a text part, emphasizing the service’s seriousness and independence from conventional programs. At first, it consisted of a contoured screen and a comparison graph. The display was made in the form of an open line forming a rectangle in which a PC or laptop monitor was well recognized. At the bottom were four wide columns of different heights: the shortest was the left element, the tallest was the right. All corners were rounded, and the line had smooth transitions, giving users a feeling of absolute security.
2016 – 2020
The designers turned the screen straight (before that, it was turned to the side) and reduced the thickness of the bezel. Moreover, the display formed from the negative space was much wider than before. Even though the developers left the corners smooth, the ends of the line were cut off and had a smooth edge. But the authors of the graph rounded the columns even more. At the same time, their height was different, and they stood interspersed, without a clear sequence. The logo’s color has lightened up a bit, and instead of dark yellow, a pale gold has appeared.
2020 – today
The current emblem does not resemble the debut emblem in any way, as it has been reduced to a minimum. It does not contain a frame in the form of a display: its designers have finally removed it. Only a bar chart remained from the previous version, consisting of three large elements. They look like vertical rectangles with rounded corners. Each of them is painted in its color – from pale yellow to dark sand.
Power BI: Interesting Facts
Power BI is Microsoft’s tool for data visualization and business intelligence. It’s designed to help users create reports and dashboards from various data sources.
- Start and Growth: Launched within Excel in 2013 and becoming its service in 2015, Power BI shows Microsoft’s strong focus on business analytics.
- Connects to Many Data Sources: Power BI works with many data types, from Excel sheets to databases and cloud services. This lets companies of all sizes analyze their data in one place.
- Power BI Desktop and Service: Power BI Desktop is a free tool for making reports, while Power BI Service is a paid online service for sharing them.
- Natural Language Queries: Power BI’s Q&A feature allows anyone to ask data questions in plain language and get visual answers, making analytics easy even for non-experts.
- Custom Visuals Marketplace: Power BI lets users download or share custom data visuals, expanding its analysis capabilities through community contributions.
- Power BI Embedded: This feature lets developers embed Power BI reports in their applications, offering advanced data visualization directly in their products.
- Works with Azure and AI: Power BI uses AI and machine learning to offer advanced data analysis, like trend predictions and insights.
- Regular Updates: Microsoft updates Power BI monthly, adding features and fixing issues based on user feedback. The Power BI community is a great place for support and ideas.
- Transforms Decision-Making: Power BI makes it easier for businesses to make informed decisions by offering clear data insights to everyone, data scientists.
- Awards: Gartner and others have recognized Power BI as a leader in its field. The company is celebrated for its impact on business intelligence.
Power BI is notable for its adaptability, powerful features, and strong community, making it a top choice for business analytics.
Font and Colors
The logo was constantly modernized, evolving from a complex configuration to a simple one. This added modernity and clarity to it so that users’ attention was immediately riveted to the diagram. The number of columns has also changed: it has been reduced from four to three.
The emblem consists only of graphic symbols, so there is nothing except for the icon. The color palette has always remained in the spectrum of pastel-gold hues. It used pale yellow, golden, dark sand.
Power BI color codes
| Crayellow | Hex color: | #f6d958 |
|---|---|---|
| RGB: | 246 217 88 | |
| CMYK: | 0 12 64 4 | |
| Pantone: | PMS 129 C |
| Mustard Yellow | Hex color: | #e9b51c |
|---|---|---|
| RGB: | 233 181 28 | |
| CMYK: | 0 22 88 9 | |
| Pantone: | PMS 7408 C |
| Mustard Brown | Hex color: | #c9800e |
|---|---|---|
| RGB: | 201 128 14 | |
| CMYK: | 0 36 93 21 | |
| Pantone: | PMS 138 C |


